🗺️ Heatmap Interface Overview
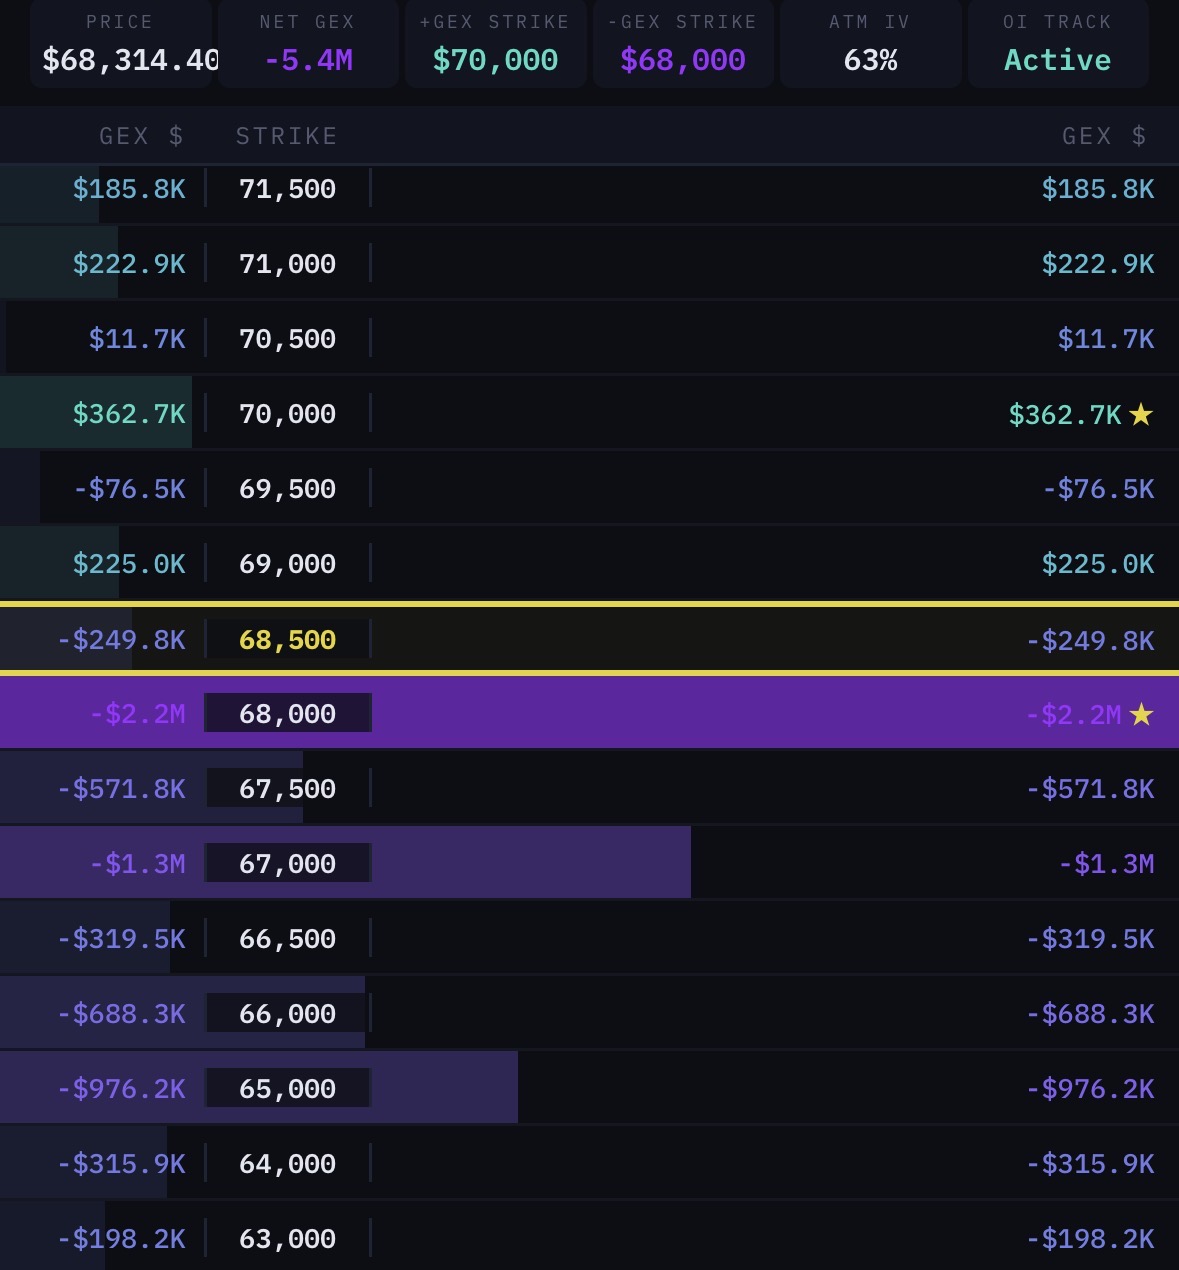
The GEX/VEX heatmap displays dealer exposure at each strike price as a horizontal bar chart. Each row represents one strike, with the bar length and color indicating the magnitude and type of exposure.
📊 Header Panel
The top panel provides a snapshot of the overall market state:
| Field | Description |
|---|---|
| PRICE | Current spot price of the underlying |
| NET GEX | Sum of all strike-level GEX values. Positive = stabilizing. Negative = volatile environment |
| +GEX STRIKE | The strike with the largest positive GEX — the primary "magnet" or "pin" level |
| −GEX STRIKE | The strike with the largest negative GEX — the primary "accelerant" level |
| ATM IV | At-the-money implied volatility, indicating the market's expected move |
| OI TRACK / EXPIRY | The expiration being tracked and its time to expiry |
When viewing VEX, the header shows NET VEX, +VEX STRIKE, and −VEX STRIKE instead.
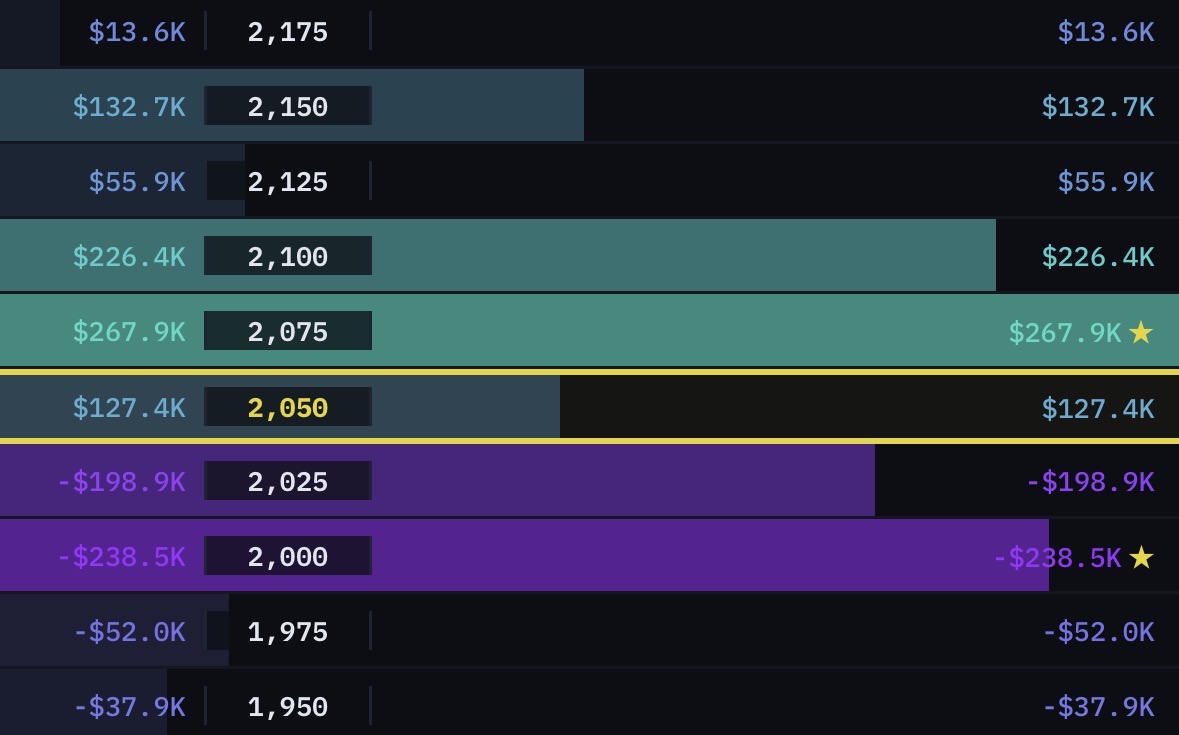
🎨 Color Coding
GEX Mode
| Color | GEX Sign | Name | Meaning |
|---|---|---|---|
| ■ Green | Positive (+) | Yang (양) | Dealer positioning absorbs price movement. Lower volatility. Price tends to move smoothly. |
| ■ Purple | Negative (−) | Yin (음) | Dealer positioning amplifies price movement. Higher volatility, "wicky" interaction. Overshoot before reversal is common. |
VEX Mode
| Color | VEX Sign | Name | Meaning |
|---|---|---|---|
| ■ Green | Positive (+) | Yang (양) | IV decline drives dealer buying. IV spike drives dealer selling. |
| ■ Purple | Negative (−) | Yin (음) | IV decline drives dealer selling. IV spike drives dealer buying. |
📏 Reading Node Values
Each strike shows a dollar value (e.g., +$1.8M, −$3.4M). This represents the notional exposure at that strike.
Absolute Value is King
The most important factor is not whether a node is positive or negative. What matters most is the absolute value:
The larger the absolute value, the stronger the influence on price.
A −$5M node is more influential than a +$500K node, regardless of sign. The sign tells you how price will interact (smooth vs. volatile); the absolute value tells you how strongly.
⏰️ Expiration Filters
| Filter | Use Case |
|---|---|
| ALL | Aggregate view across all expirations. Best for understanding the overall positioning landscape. |
| 0DTE / NEAREST | Same-day or nearest expiration. Highest gamma. Best for intraday trading. |
| ≤7D | Weekly view. Good for swing trades and near-term structure. |
| ≤30D | Monthly view. Shows larger structural positioning including OPEX-related flows. |
| Specific Expiry | Isolate a single expiration date to analyze its unique contribution. |
Why Expiration Matters
Gamma increases as expiration approaches. A strike with 1 day to expiry will have far more gamma than the same strike with 30 days to expiry:
- 0DTE/NEAREST maps show the most immediately impactful levels
- ≤30D maps reveal larger structural positioning that may dominate on a weekly/monthly timeframe
- Individual expiry views help identify whether a node's influence will expire soon or persist
🔀 Switching Between GEX and VEX
Use the GEX / VEX toggle in the header to switch views. Both views share the same strike layout, making it easy to compare:
- Note key levels on the GEX map
- Switch to VEX
- Check whether those same strikes show confluence (same sign) or opposition (opposite signs)
Confluence between GEX and VEX at the same strike creates higher-conviction levels.
🔍 Identifying Key Structures
When you open a heatmap, look for these structures in order:
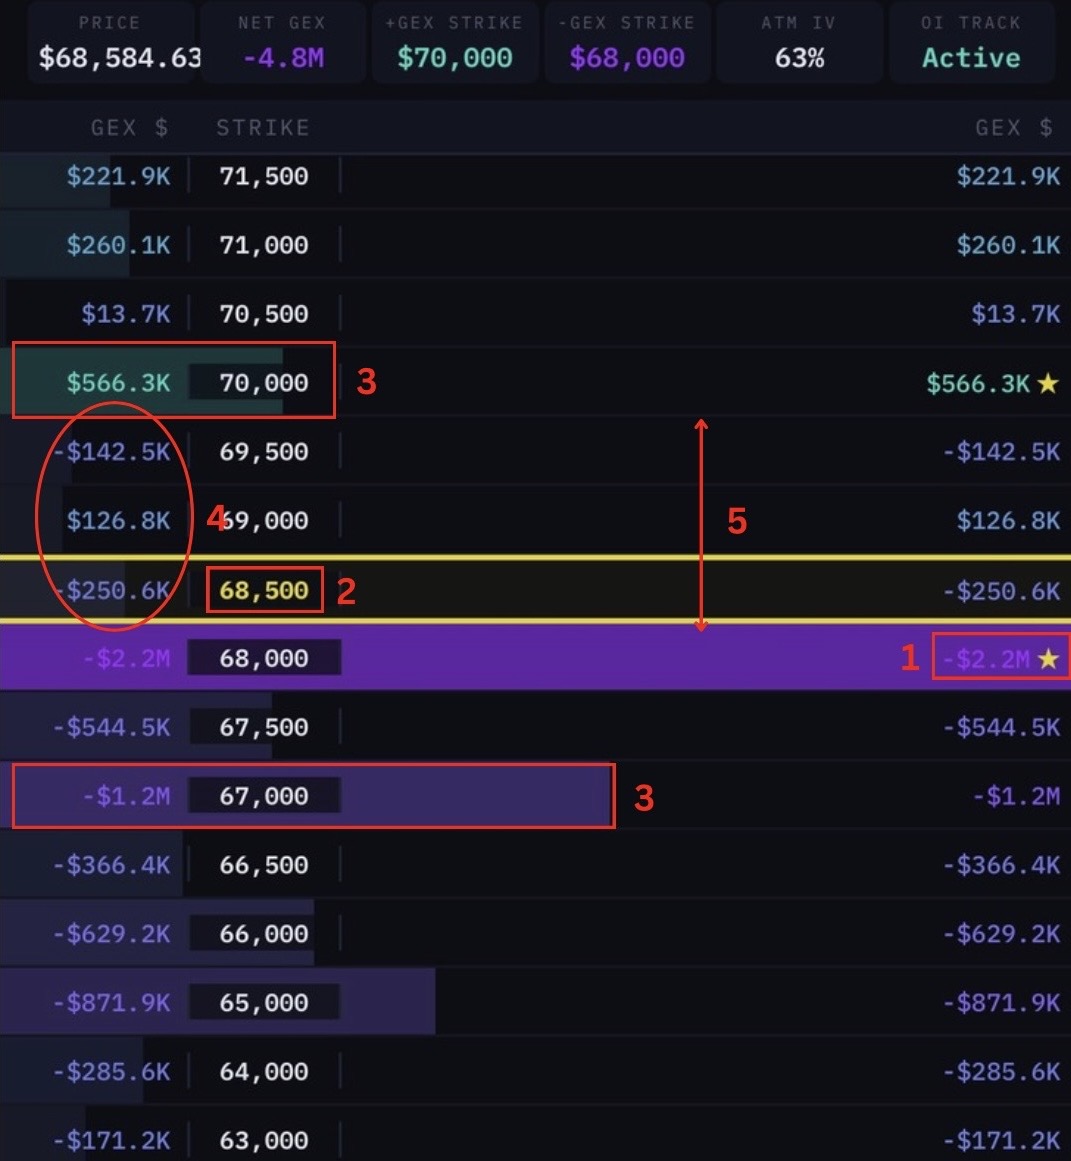
1. Find the Dominant Nodes
Scan for the largest absolute values. These are your primary levels of interest. Don't clutter your analysis with every small node — focus on the ones that stand out.
2. Locate the Spot Price
The yellow horizontal line indicates current spot price. Note where spot sits relative to the major nodes.
3. Map the Zones
Above spot: What is the character? Mostly positive (stabilizing) or negative (volatile)?
Below spot: Same question. A wall of negative GEX below spot is a warning sign for potential acceleration to the downside.
4. Identify Voids
Look for clusters of $0 or near-$0 nodes between larger nodes. These are zones with minimal dealer positioning — price can move through them quickly with little resistance.
5. Check for Asymmetry
Is the positioning balanced above and below spot, or heavily skewed to one side? Asymmetry in node distribution creates asymmetry in market behavior.
⭐ Star Markers
Nodes marked with a ★ indicate the largest absolute value nodes (Anchors) on the current map. These are the most influential levels and should be your primary focus.
📚 Key Takeaways
- Absolute value > sign or color when assessing node importance
- Use the header panel for a quick read on the overall environment (NET GEX/VEX, key strikes)
- 0DTE/NEAREST for intraday, ≤7D for swing, ≤30D for structural analysis
- Compare GEX and VEX at the same strikes for confluence
- Focus on dominant nodes, spot position, zones, voids, and asymmetry