Quickstart — Your First GEX Insight in 5 Minutes
GEXFlow's heatmap can look overwhelming the first time you open it. Dozens of bars, two color signs, multiple filters, a header full of numbers. The good news: you don't need to read all of it to get a useful first observation. In real day-trading use, the workflow comes down to four steps — and you can complete them in about five minutes.
This guide walks through that workflow using a live BTC 0DTE example. By the end, you'll have a single, defensible observation of where market structure is concentrated, and you'll know what to watch for next.
A note on what this guide is: This is one practical observation routine, oriented toward short-term (0DTE) reading. The same four steps adapt to swing or structural views by changing the expiry filter (≤7D, ≤30D). GEX/VEX are market structure context — not buy or sell signals. Always confirm with price action.
Before You Start: The Header at a Glance
Once you load the BTC 0DTE heatmap, you'll see a header panel at the top with values like PRICE, NET GEX, +GEX STRIKE, −GEX STRIKE, and ATM IV.
You don't need to study these in depth. A useful glance is just this: if NET GEX is negative, today's environment may lean more volatile; if positive, more stabilized. Treat this as background atmosphere, not as an actionable signal. The real workflow starts with the individual strike-level nodes below the header.
In our example, NET GEX reads −11.5M — a hint that today is in the more volatile half of conditions, but nothing more.
Step 1 — Find the Max Absolute Node
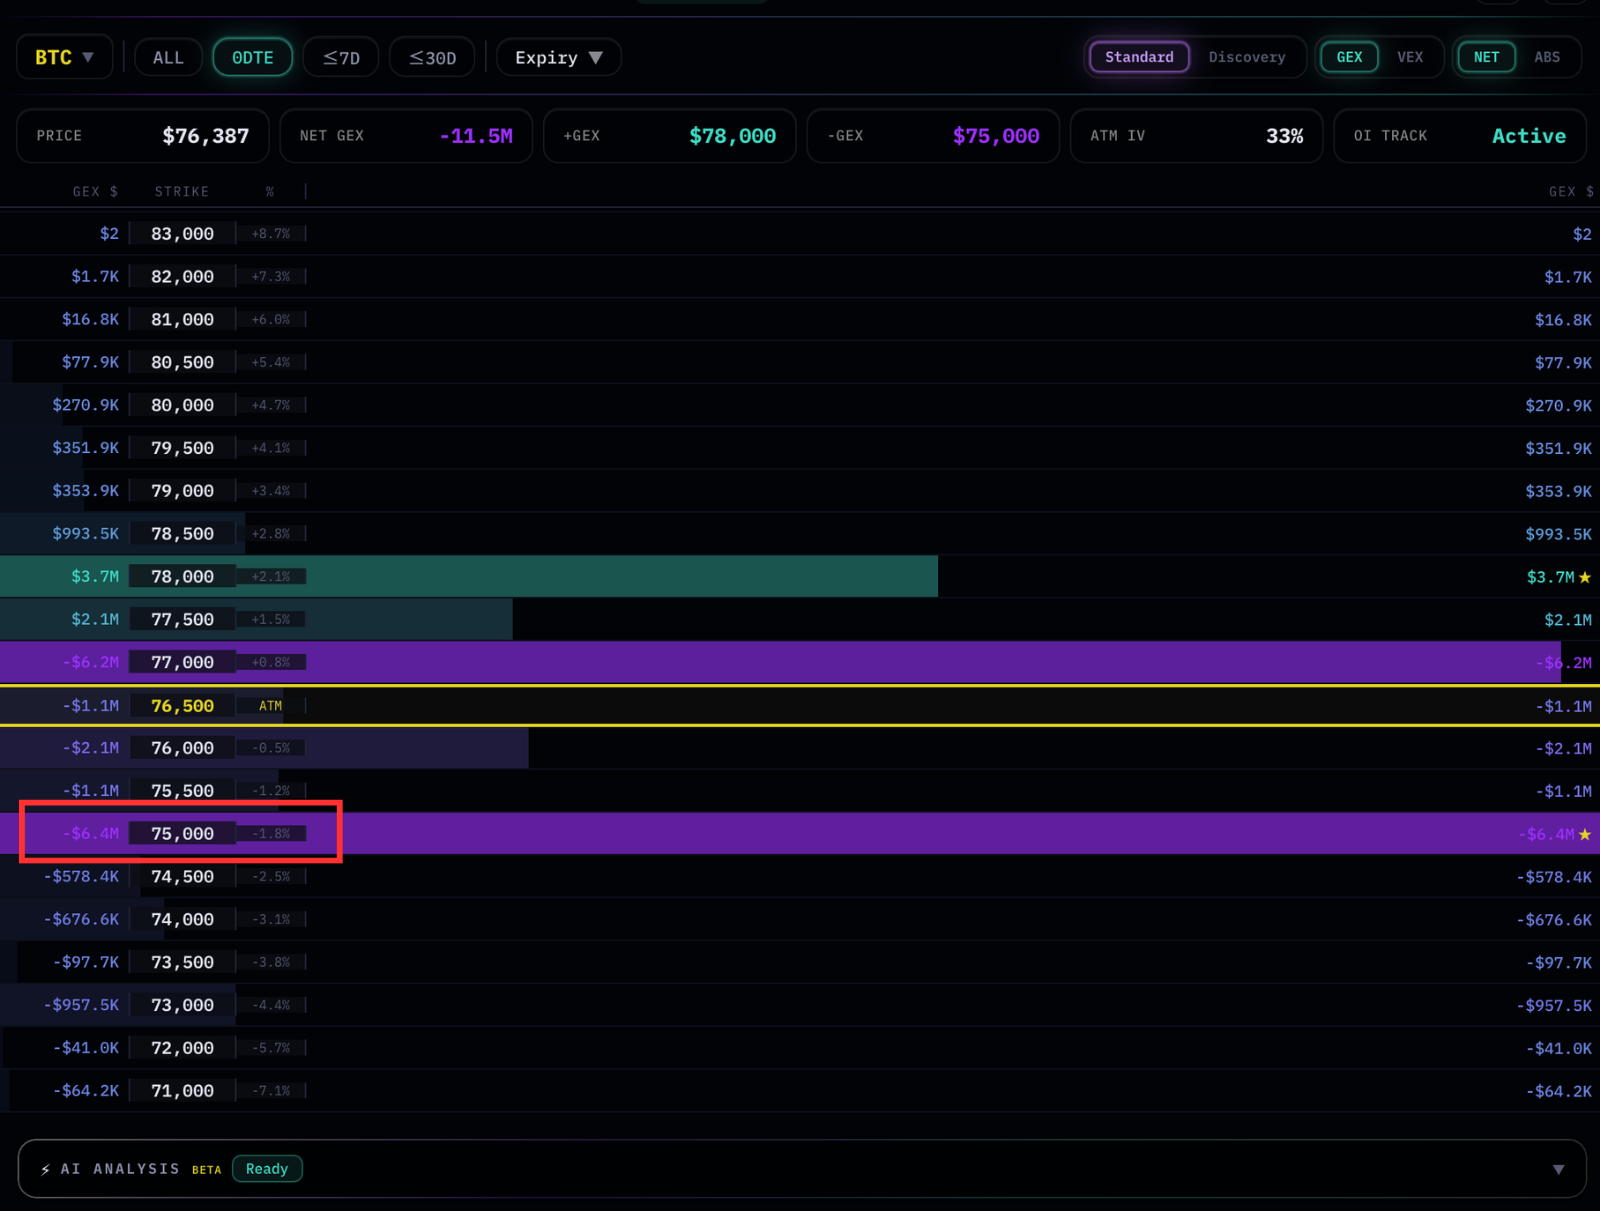
Scroll through the GEX heatmap and find the single node with the largest absolute value. Sign (positive or negative) is not what matters here — only magnitude. This is where dealer-implied gamma exposure is most concentrated, and it's the strongest gravitational point on the map.
In our BTC example, the Max node is at $75,000 with −$6.4M in GEX. You'll see it marked with a ★ in the interface. Negative sign means the structure around this strike is the kind that, when dealer positioning matches the inference, tends to amplify price movement rather than absorb it.
The Max node is always your first reference point. Everything else gets read relative to it.
Step 2 — Find the Major Nodes (50%+ of Max)
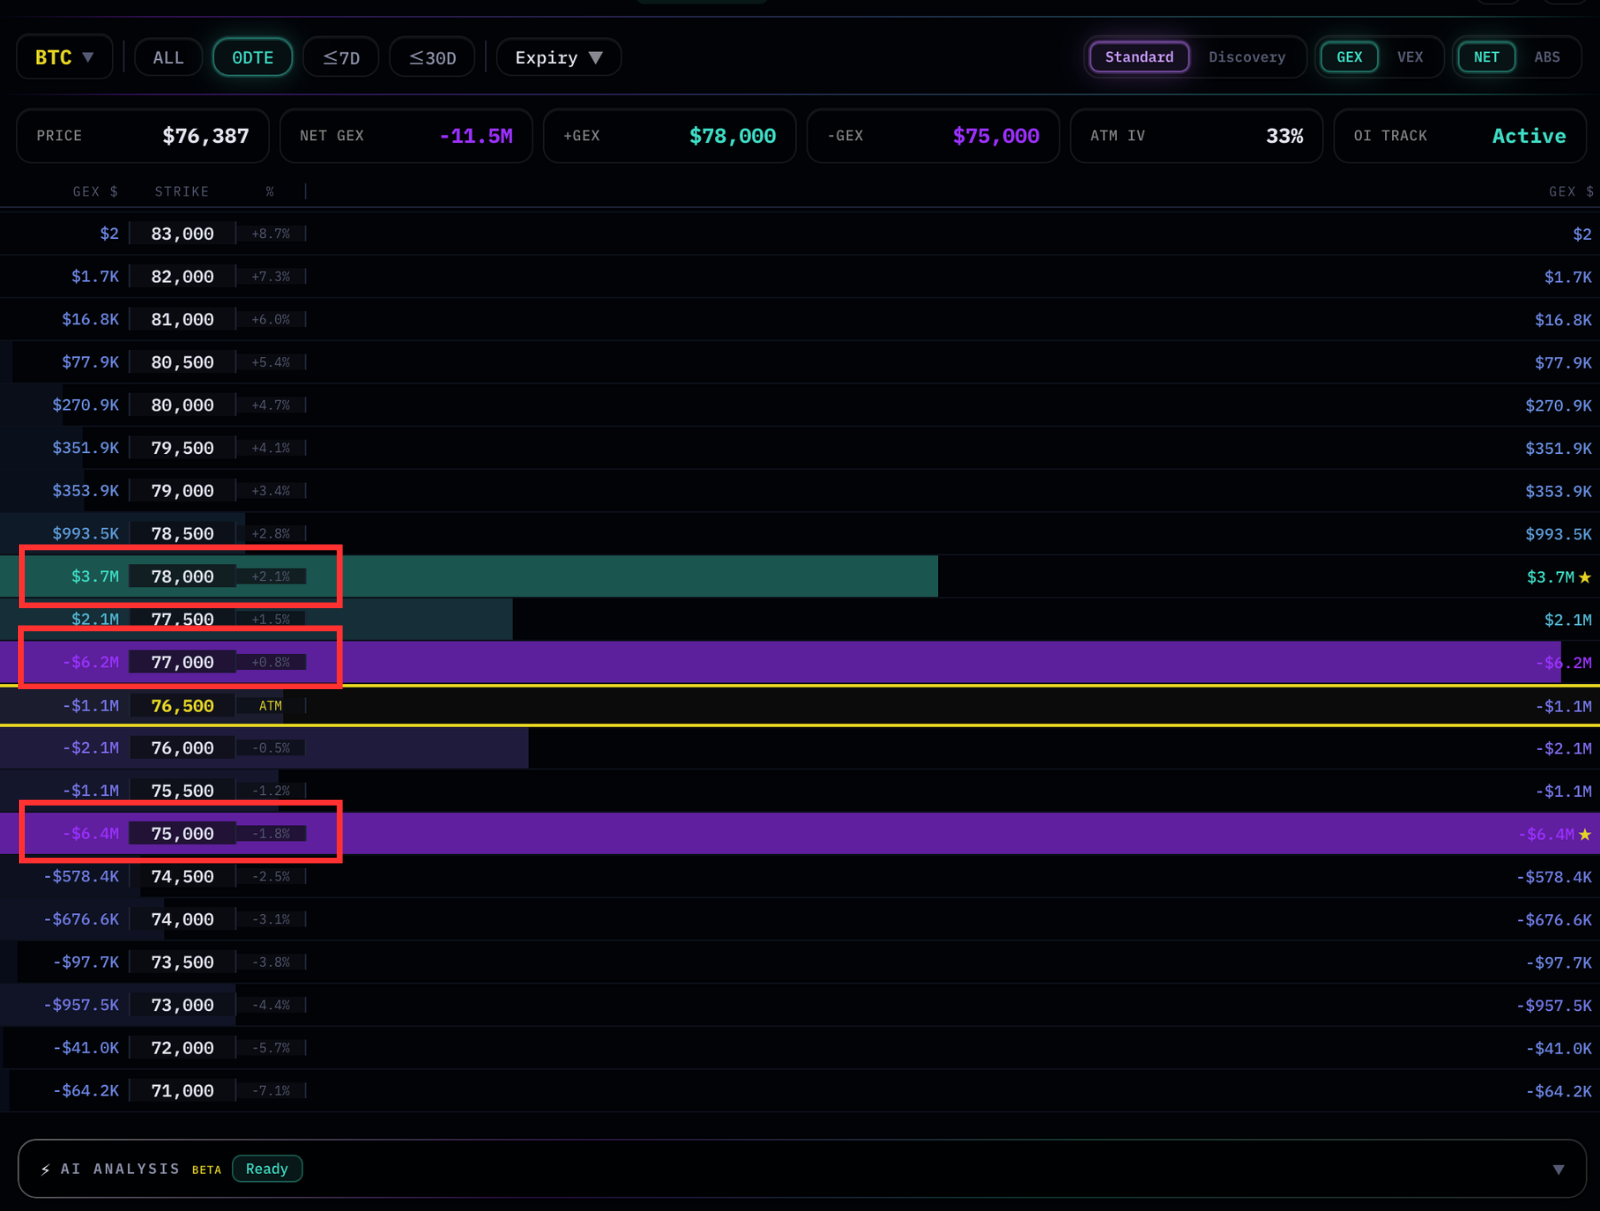
Once you have the Max, look for any other nodes whose absolute value is at least 50% of the Max. These are your major nodes — secondary levels strong enough to influence price interaction in their own right. Everything smaller is noise for this purpose; you can ignore it on first pass.
In our example, two more nodes qualify:
- $77,000 with −$6.2M — sitting right at the ATM line; nearly as large as the Max
- $78,000 with +$3.7M — a positive node just above current price, the largest positive in the field
So three strikes carry the weight of today's BTC 0DTE structure: $75,000, $77,000, and $78,000. The rest can be set aside for now.
Step 3 — Mark Them on Your Price Chart
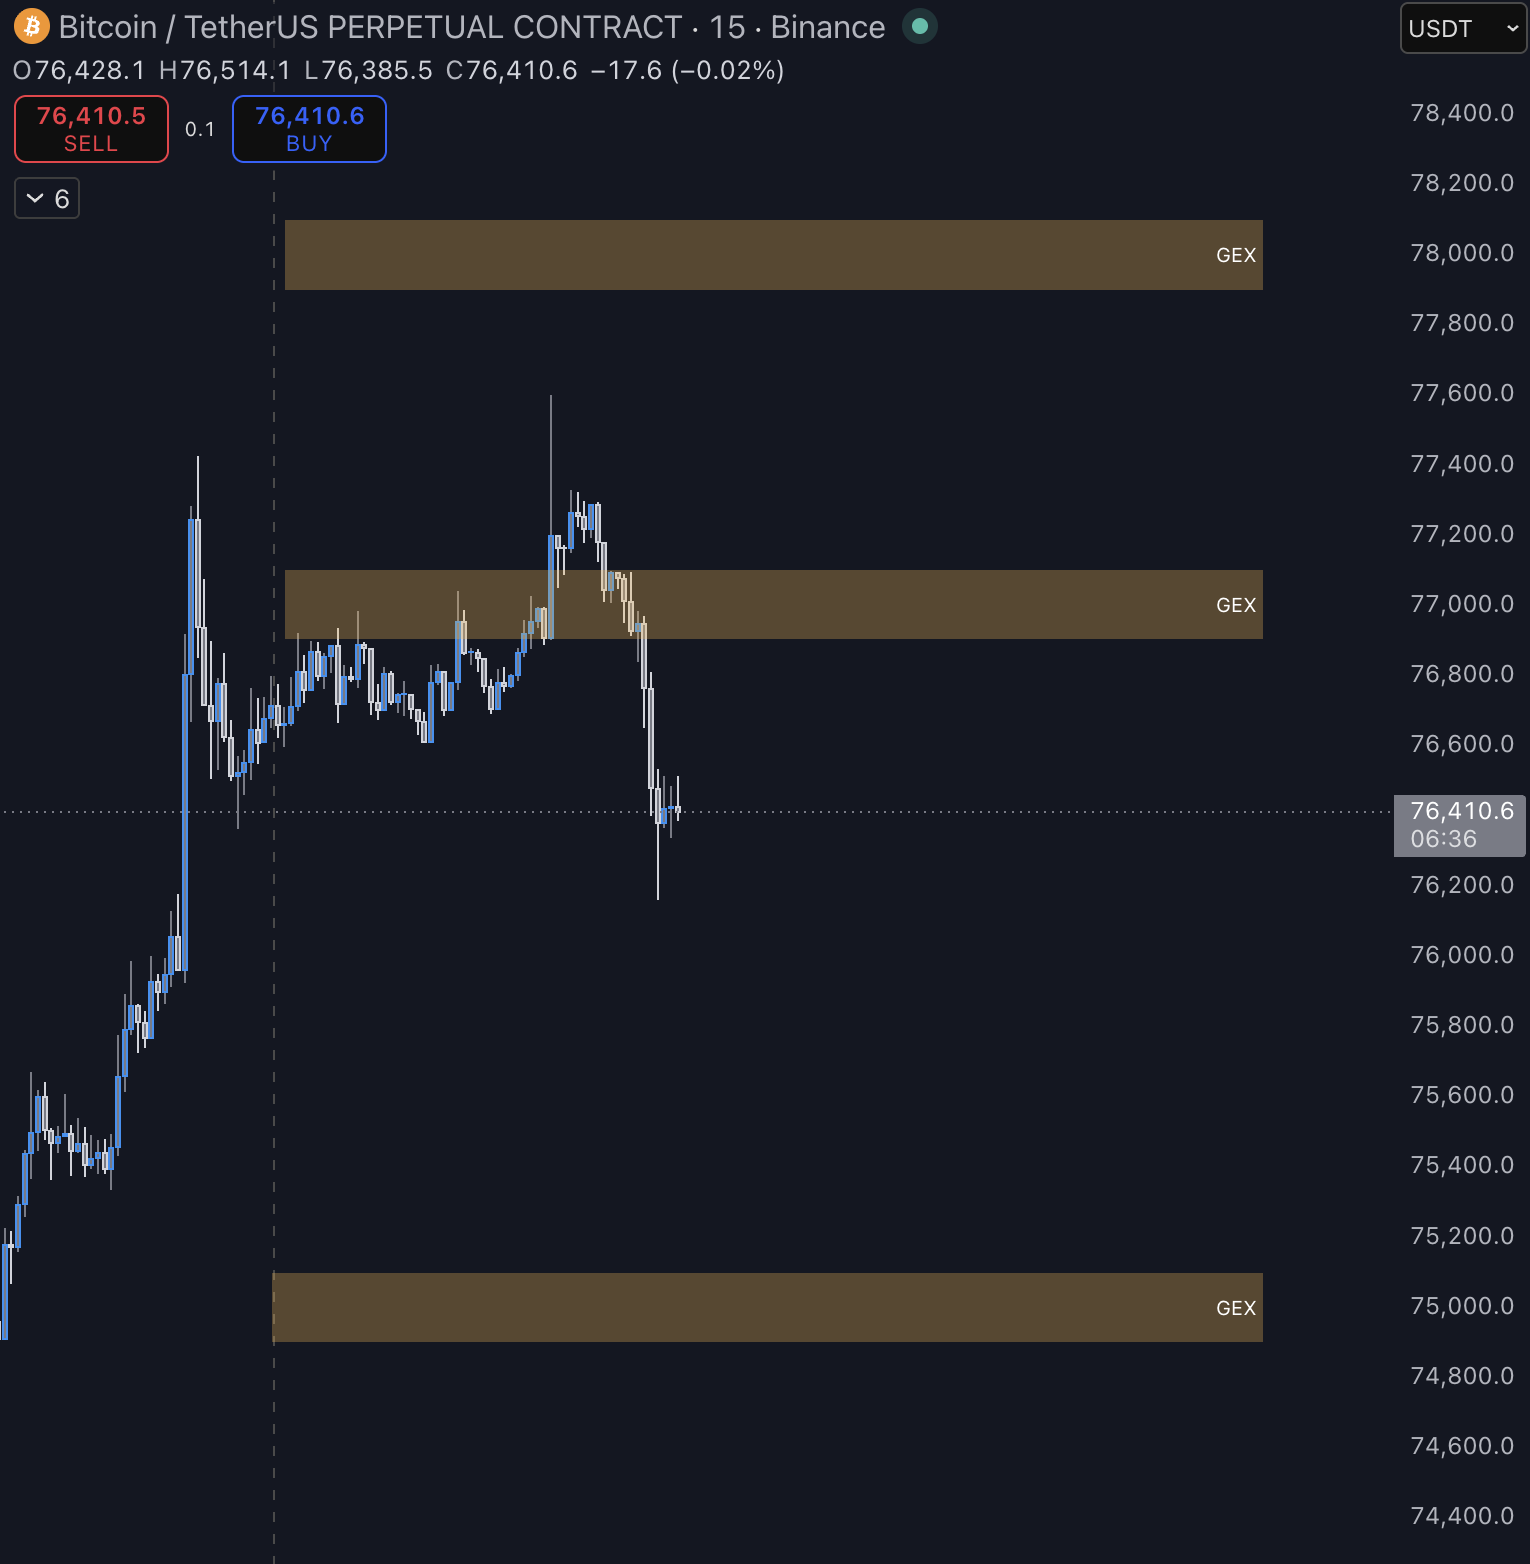
GEXFlow shows you the gamma landscape; your price chart shows you what price is actually doing. The two only become useful together. Open your preferred charting tool (TradingView, your exchange's chart, whatever you use) and draw horizontal lines at each of the major nodes you identified.
Why mark them? Because GEX nodes are not predictions of where price will go — they're descriptions of where dealer hedging may exert the strongest pull, the strongest acceleration, or the strongest resistance. Marking them on your price chart turns them into reference levels you can watch in real time. When price approaches one, you have a defined zone of interest. When price moves between them with nothing in the way, you're in a relatively open stretch.
Keep these lines on your chart for the duration of the session. They're your structural map for the day.
Step 4 — Check VEX Confluence at the Same Strikes

Now switch the heatmap to VEX mode using the toggle in the header. The strike layout is identical — only the values change. Look at the same strikes you marked in Step 2 and note the VEX value and sign at each.
In our example:
- $75,000 — VEX +$417.9K (the largest VEX node on the entire map, also marked ★)
- $77,000 — VEX −$5.9K (small, near the ATM)
- $78,000 — VEX +$157.1K (positive, second-largest VEX node)
This is the most important reading of the workflow. The largest GEX node ($75,000, −$6.4M) and the largest VEX node ($75,000, +$417.9K) sit at the same strike. The signs are opposite — but that's secondary. What matters is that both forms of dealer hedging activity, gamma-driven and vanna-driven, are concentrated at the same level.
What This Gives You
Putting the four steps together, here's the observation our example yields:
$75,000 carries the largest absolute exposure in both GEX and VEX simultaneously, with GEX negative and VEX positive. This makes it the level most worth watching for price gravitation — not because the structure predicts price will reach it, but because both gamma and vanna hedging activity are concentrated there. $77,000 (just below current price, large negative GEX, near-zero VEX) and $78,000 (large positive GEX, positive VEX) act as secondary structural anchors above and below.
Reading this in plain trading language: the structure points to $75,000 as the level to watch most closely for whether price gravitates toward it. The negative GEX sign at that strike suggests that if price reaches it, the interaction may be volatile — wicky, with potential overshoot — rather than smooth. The positive VEX adds a layer of nuance: if IV compresses today, that's an additional pull toward $75,000; if IV expands, that pull weakens.
None of this is a directional call. It's a structural map: where to pay attention, what kind of behavior to expect at each level, and what to watch IV doing in the background.
Adapting to Your Timeframe
This walkthrough used the 0DTE filter, which is appropriate for day-trading observation. The same four steps apply to other horizons by changing the expiry filter:
- ≤7D for swing-trade structural reading
- ≤30D for monthly OPEX positioning
- ALL for the aggregate landscape across all expiries
Larger expiry windows tend to surface different nodes, since further-dated options carry less gamma per contract but can accumulate significant total exposure. The workflow doesn't change — only what you'll see at each step.
What to Read Next
You now have a working observation routine. To deepen it:
- Heatmap Walkthrough → — A complete tour of the heatmap interface: color coding, expiry filters, the ★ anchors, asymmetry reading, and the smaller features this Quickstart skipped.
- Constellation Walkthrough → — How to see GEX evolve over time on a price chart, rather than reading a single snapshot. Useful for spotting accumulation, dissipation, and reshuffle patterns.
- Concepts: Understanding GEX → — The full theoretical foundation: payoffs, delta, gamma, dealer hedging, and why GEX behaves the way it does.
- Concepts: GEX/VEX Confluence → — A deeper treatment of how to read same-sign and opposing-sign confluence between GEX and VEX, and how to incorporate multi-index agreement on US equities.
A Final Reminder
The four-step workflow gives you a map, not a destination. GEX and VEX describe market structure — they tell you where dealer hedging activity is concentrated and what character of price interaction may emerge at those levels. They do not tell you which direction price will go next.
Always pair the map with what price is actually doing. The strongest setups in any framework — including this one — come from structure and price action confirming each other, not from structure alone.